Quantifying Non-Interpretive Work
One radiology practice’s method for quantifying non-interpretive activities demonstrates their unmatched value.
“Stagnation is the first step on the path of irrelevance that leads to extinction.” This motto has guided Samir B. Patel, MD, FACR, value management program founder and director of Radiology Inc. in north central Indiana, for years. Patel, who also serves as a member of the board of directors at Beacon Health System, the region’s largest locally owned and operated nonprofit healthcare system, knows firsthand how it feels to be on the verge of extinction.
 Samir B. Patel, MD, FACR, value management program founder and director of Radiology Inc., pioneered the Radiology Value-Added Matrix, a data visualization tool that quantifies non-interpretive relative value unit activities. |
In 2010, Patel’s group entered into contract negotiations with one of its client hospitals. During the talks, the hospital president reached out to physician leadership to assess how they perceived Radiology Inc. “Although we’ve provided radiology services to our hospital system for over 100 years, our referring providers had taken the position that if our group didn’t want to accept the hospital’s terms, then the president should feel free to sever ties with us,” explains Patel.
The referring providers erroneously believed that the radiologists solely read images. Therefore, they thought that Radiology Inc. would be easy to replace. They didn’t consider that the radiology group performs a range of activities beyond image interpretation, such as developing protocols, serving on hospital committees, and engaging in peer review. While the value of these tasks is meaningful, they had proven elusive to quantify until 2012, when Patel developed the Radiology Value-Added Matrix to help prove his group’s worth to the hospitals they serve. (Read more about the early days of the Radiology Value-Added Matrix in this case study.)
In the nearly 10 years since developing the matrix, Patel has documented over 100,000 hours of value-added work. He reports that, based on the Medical Group Management Association’s average hourly rate for a radiologist’s time, if the average radiologist’s compensation per hour is assumed to be $250, then this would equate to around $25 million in value attributed to Radiology Inc. during that time. Such figures bring the practice’s work to life in a way that job assessments rarely do. This approach not only helped preserve Radiology Inc.’s century-old hospital contract, but it also positioned the practice as an indispensable leader in the health system.
In developing the Radiology Value-Added Matrix, Patel used a straightforward formula to quantify the value of his group’s non-interpretive activities: each individual radiologist’s value-added hours are totaled and added to value-added hours that are attributed to the entire practice. Then the summed total hours are multiplied by an average radiologist hourly compensation derived from a national salary database. The database Patel prefers is one provided by the Medical Group Management Association, a professional organization for medical practice administrators and executives. When tracked over time, this tabulation revealed the monetary worth of the group’s non-interpretive work.
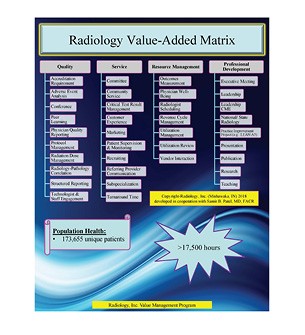 The Radiology Value-Added Matrix organizes and quantifies all non-interpretive relative value unit activities in which practice members participate. |
Beyond crunching the numbers, Patel knew that he needed to present this data to hospital leaders in a direct way. To do so, he created the Value-Added Matrix. The tool helped Patel tell Radiology Inc.’s value-added story in an easily digestible and compelling format. “We compiled our data into a ‘scorecard’ that clearly demonstrates our non-interpretive work that benefits the hospital system,” Patel explains.
From the start, the Radiology Value-Added Matrix and the accompanying report provided hospital leadership and medical staff with a more rounded picture of the high quality of care Radiology Inc. consistently delivers. As a result, stronger bonds of trust were forged between the group and their care partners. After seeing the immediate impact the matrix made on both radiologists and hospital leaders, Patel knew he needed to continue tracking and sharing these value-added activities on a regular basis. So, he incorporated the scorecard into a detailed annual report that he shares with a variety of stakeholders.
True to Patel’s desire to avoid stagnation, over time the matrix has evolved from a list of activities collected using pencil and paper to a digital catalog of accomplishments stored inside an app installed on participants’ phones. The app, which also helps with parts of the group’s revenue cycle management, has been customized to pull data from a variety of databases. The group’s scheduling software tracks certain markers like conferences attended and commit-tees joined and automatically populates the matrix app with that data, alleviating the need for manual entry. For value-added data that isn’t automatically captured, Patel and members of the group’s business office enter it manually.
 Pedro Miro, MD, diagnostic radiologist at Radiology Inc., is optimistic that tools like the matrix will help radiologists find their footing in the era of value-based healthcare. |
“For me, it takes approximately 5-10 hours per month to compile the data. When the report is completed, typically by May or June of each year, we present it to our practice’s executive board and also share it individually with our hospital client’s CEO and other members of the c-suite, such as hospital presidents,” Patel says.“Everyone in our practice also receives a hardcopy of the report.”
To encourage ongoing participation in this team effort, Patel constantly explores ways to lessen the administrative burden on his colleagues. “We do not have minimum value-added requirements for each radiologist,” explains Patel. “We value both interpretative and non-interpretative activities.” For those team members who would prefer to focus exclusively on interpreting images, Patel notes that while this choice is respected, he asks these colleagues not to obstruct the program in any way.
To lower barriers to entry and encourage those interested in contributing to the matrix, Patel works with his business office team to continually look for easier ways to collect value-added data. “We regularly solicit feedback from staff radiologists and members of the business office to make sure we’re being as efficient as possible,” says Patel. “Additionally, program champions periodically share their accomplishments, thereby fostering friendly competition and enticing everyone to submit entries.”
Patel defines program champions as anyone wishing to recognize value-based achievements by any group member during monthly practice executive board meetings, an approach that is supported by the practice’s executive board chair and chief administrative officer. Recent accomplishments include a third member of the practice having attained ACR Fellowship status, along with three practice members joining multiple health system boards. To ensure the matrix remains relevant to his colleagues, Patel updates the categories every few years. “Updating the matrix focuses our practice on non-interpretive actions that are important in the marketplace and in organized radiology,” Patel observes.
Through the years, Patel and his colleagues have increasingly used the matrix to tell an all-encompassing story about the important place that the practice occupies in the spectrum of patient care. “We’re laying out a case for why we’re indispensable and how we make our client hospitals better,” explains Pedro Miro, MD, diagnostic radiologist at Radiology Inc. and past chair of the group. “Our professionalism, desire to improve, and the evidence-based approach to our work are all on display and quantified in the matrix.”
 The Radiology Value-Added Matrix and its accompanying yearly report act as an effective reminder of the range of valuable tasks to which the radiology team contributes, says Kreg Gruber, CEO of Beacon Health System. |
Everyone from the CEO of the group’s largest health system client to Patel’s own radiologist colleagues have come to recognize the value of the radiology group as a result of the matrix. “Each year, Dr. Patel’s report reminds me of all the different valuable tasks the radiology team is plugged into and where they are contributing,” says Kreg Gruber, CEO of Beacon Health System. “It affirms that the radiology group isn’t just talking about adding value but is actually demonstrating it.”
Forged in the fire of active contract negotiations, the matrix has helped shape these conversations ever since. “Negotiations between radiologists and clients can be adversarial, time consuming, and challenging,” explains Patel. “The matrix has shown decision-makers that we are a trusted partner so that negotiations never have to become adversarial. We’ve engendered trust by illustrating every year that we’re bringing substantial value to the hospital system.”
Gruber agrees that the matrix has helped strengthen the relationship between the hospital system and the radiology group. “The summarized annual report that Dr. Patel provides creates an opportunity for the radiology leadership to be in contact with and in front of key leaders in the health system,” Gruber explains. “Sometimes, just that little bit of time creates a relationship. Time develops familiarity, familiarity breeds trust, trust supports speed to decisions, and speed to decisions fuels success.”
Since it began using the matrix, Radiology Inc. has not only solidified its position as a reliable partner in coordinated care delivery, but it has also become a leader within the health system. Once on the brink of losing a hospital contract, Patel is now an influential member of the board of directors at Beacon Health System, where he has established stronger ties with clinical colleagues and helped drive decision-making on a system level. “The Radiology Value-Added Matrix and annual report help our practice continue to earn and retain greater trust with our care collaborators, which is a valuable asset,” Patel says. “Referring physicians and administrators alike now perceive us as a valuable partner in helping them achieve their goals.”
This credibility is never more important than when client hospitals are considering new initiatives, says Patel. “It’s nice to be thought of in the planning stages of an initiative, as opposed to being an afterthought,” Patel notes. “It’s not ideal to be apprised of a new project at the implementation stage. The matrix has afforded us the opportunity to be thought of in the planning stages of most value-related projects at our hospitals because of the trust it’s helped us develop. Trusted partnerships are hard to earn, but they’re so beneficial.”
This is particularly true in the era of value-based healthcare, in which fee-for-service reimbursement is giving ground to alternative payment models. Miro is optimistic that tools like the matrix will help radiologists find their footing. “Health entities need data and metrics to show the Centers for Medicare & Medicaid Services, accountable care organizations, and other similar value programs that they’re improving quality,” Miro elaborates. “Endeavors like increasing mammogram and lung cancer screening uptake, and showing that cancers are being detected at earlier, more treatable stages are key metrics that are captured in our Radiology Value-Added Matrix.”
For practices that want to capture these benefits with their own Radiology Value-Added Matrix, Patel recommends starting small and building incrementally. “Most practices utilize scheduling software or a manual system for conferences and committees,” Patel points out. “Start by tracking those, either electronically or manually. Many electronic systems allow users to download this information into a database, such as Microsoft Excel, which is what we utilize.”
As much as the matrix preserves the group’s past activities, it also provides a shining beacon for the road ahead. Patel sees a bright future for his practice, one in which it will continue to evolve with the changing times: “The Radiology Value-Added Matrix provides a true north direction, structure, and process for our practice to be successful in the now, in the near, and in the far.”
Now It's Your Turn
Follow these next steps to develop a Radiology Value-Added Matrix where you practice, and tell us how you did at imaging3@acr.org or on Twitter with the hashtag #Imaging3:
Chris Hobson, senior communications manager